Other parts of this guide:
- Part 1. Profiling and Django settings
- Part 2. Working with database
- Part 3. Caching
Django is a powerful framework used in many great projects. It provides many batteries, that speed up development and therefore reduces the price of it. When a project becomes large and is used by many users you inevitably will run into performance problems. In this guide, I will try define potential problems and how to fix them.
This is the first part of a series about Django performance optimization. It will cover profiling and Django settings.
Profiling
Before starting to make any optimizations you should measure current performance to be able to compare results of optimizations. And you should be able to measure performance regularly after each change, so this process should be automatized.
Profiling is a process of measurement metrics of your project. Such as server response time, CPU usage, memory usage, etc. Python has its own profiler in the standard library. It works pretty good in profiling code chunks, but for profiling a whole Django project more convenient solutions exist.
Django logging
One of the most common optimization issues are needles and/or inefficient SQL queries. You could set up Django
logging to display all SQL queries into the console. Add to settings.py file:
LOGGING = {
    'version': 1,
    'disable_existing_loggers': False,
    'handlers': {
        'console': {
            'class': 'logging.StreamHandler',
        },
    },
    'loggers': {
        'django.db.backends': {
            'level': 'DEBUG',
            'handlers': ['console'],
        }
    },
}
also, make sure that DEBUG = True. After reloading server, you should see SQL queries and corresponding time
in the console for every request you make:
(0.002) SELECT DISTINCT "handbooks_size"."size_type_id", "goods_goods"."size_id" FROM "goods_goods" LEFT OUTER JOIN "handbooks_size" ON ("goods_goods"."size_id" = "handbooks_size"."id") WHERE "goods_goods"."status" IN ('reserved', 'sold', 'approved') ORDER BY "goods_goods"."size_id" ASC; args=('reserved', 'sold', 'approved')
(0.001) SELECT DISTINCT "goods_goods"."color_id" FROM "goods_goods" WHERE "goods_goods"."status" IN ('reserved', 'sold', 'approved') ORDER BY "goods_goods"."color_id" ASC; args=('reserved', 'sold', 'approved')
(0.001) SELECT DISTINCT "handbooks_size"."row", "handbooks_size"."size_type_id", "goods_goods"."size_id" FROM "goods_goods" LEFT OUTER JOIN "handbooks_size" ON ("goods_goods"."size_id" = "handbooks_size"."id") WHERE "goods_goods"."status" IN ('reserved', 'sold', 'approved') ORDER BY "goods_goods"."size_id" ASC; args=('reserved', 'sold', 'approved')
(0.000) SELECT DISTINCT "goods_goods"."season" FROM "goods_goods" WHERE "goods_goods"."status" IN ('reserved', 'sold', 'approved') ORDER BY "goods_goods"."season" ASC; args=('reserved', 'sold', 'approved')
(0.000) SELECT DISTINCT "goods_goods"."state" FROM "goods_goods" WHERE "goods_goods"."status" IN ('reserved', 'sold', 'approved') ORDER BY "goods_goods"."state" ASC; args=('reserved', 'sold', 'approved')
(0.002) SELECT MAX("__col1"), MIN("__col2") FROM (SELECT "goods_goods"."id" AS Col1, CASE WHEN "goods_goods"."status" = 'sold' THEN 1 ELSE 0 END AS "x_order", "goods_goods"."price_sell" AS "__col1", "goods_goods"."price_sell" AS "__col2" FROM "goods_goods" WHERE "goods_goods"."status" IN ('reserved', 'sold', 'approved') GROUP BY "goods_goods"."id", CASE WHEN "goods_goods"."status" = 'sold' THEN 1 ELSE 0 END) subquery; args=('sold', 1, 0, 'reserved', 'sold', 'approved', 'sold', 1, 0)
(0.001) SELECT COUNT(*) FROM (SELECT "goods_goods"."id" AS Col1, CASE WHEN "goods_goods"."status" = 'sold' THEN 1 ELSE 0 END AS "x_order" FROM "goods_goods" WHERE "goods_goods"."status" IN ('reserved', 'sold', 'approved') GROUP BY "goods_goods"."id", CASE WHEN "goods_goods"."status" = 'sold' THEN 1 ELSE 0 END) subquery; args=('sold', 1, 0, 'reserved', 'sold', 'approved', 'sold', 1, 0)
[15/Jun/2017 11:03:49] "GET /goods HTTP/1.0" 200 32583
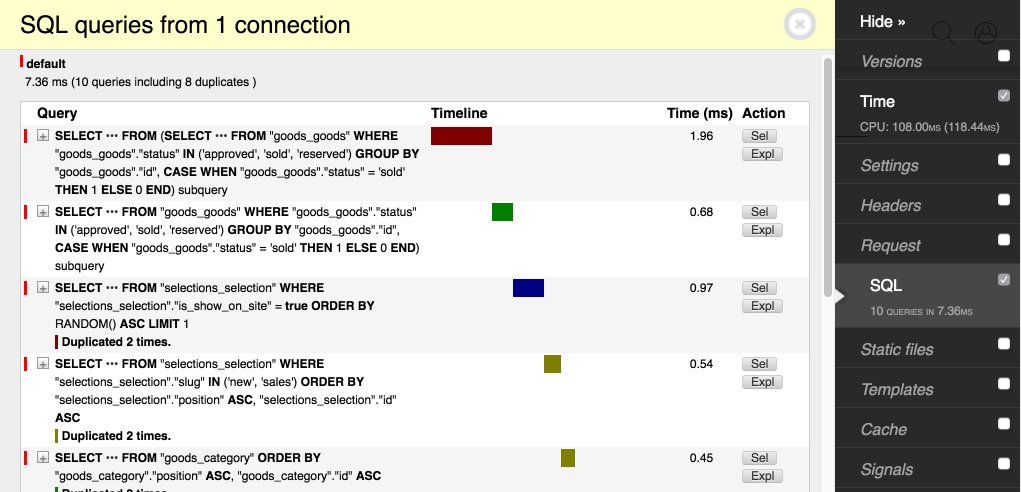
Django Debug Toolbar
This Django application provides a set of toolbars, some of
them are great for profiling. Actually, it has built-in SQL panel, that has even more informative log of SQL queries
with additional features, like time chart, traceback, a result of EXPLAIN command, etc.
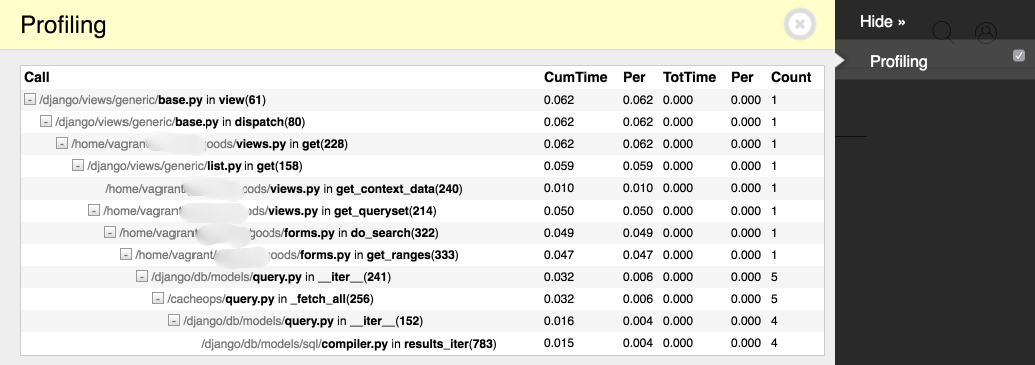
Also, DDT has non-default built-in profiling panel. It provides a web interface to profiling results of the current request.
To enable it, you should add debug_toolbar.panels.profiling.ProfilingPanel to DEBUG_TOOLBAR_PANELS list in `settings.py.
Silk
Another great package for profiling is Silk. It's especially useful if you have an API and therefore you can't use DDT. Installation instructions can be found on GitHub.
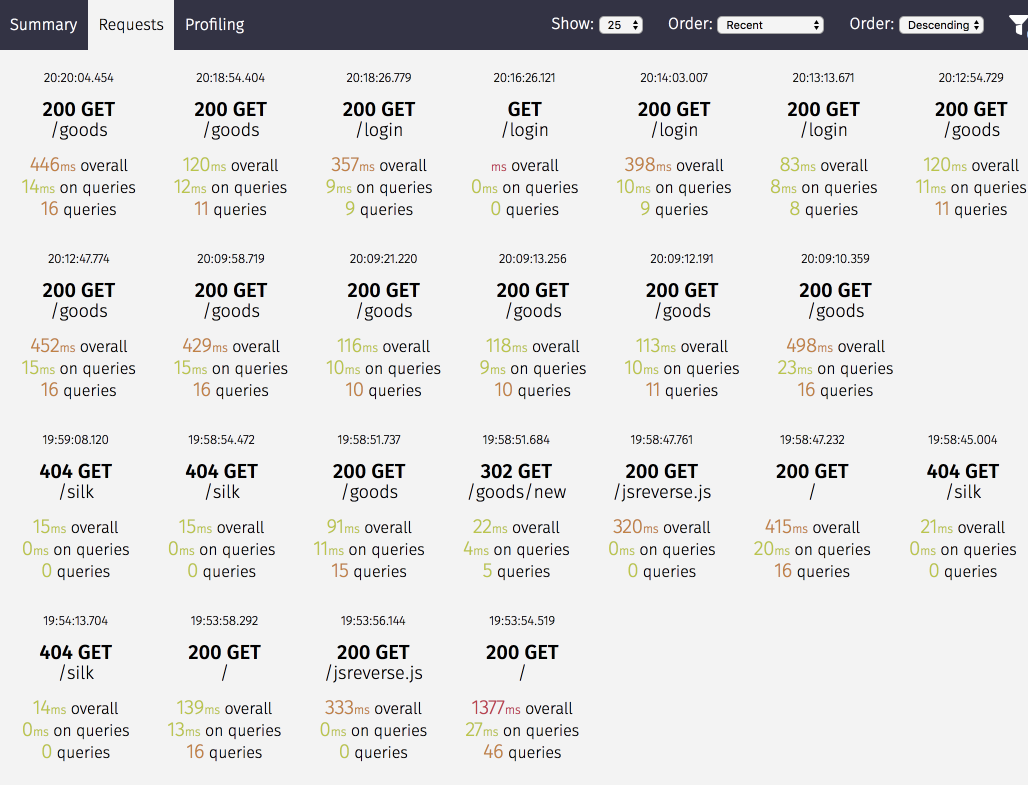
After set up you should reboot the server and open /silk/ in a browser. The web interface of Silk provides:
- Requests statistic,
- SQL queries,
- profiling results.
You can enable profiler for the whole project by setting SILKY_PYTHON_PROFILER = True in settings.py. Or you
can profile only certain functions/blocks of code with help of decorator and context processor:
from silk.profiling.profiler import silk_profile


@silk_profile(name='View Blog Post')
def post(request, post_id):
    p = Post.objects.get(pk=post_id)
    return render_to_response('post.html', {
        'post': p
    })

def post(request, post_id):
    with silk_profile(name='View Blog Post #%d' % self.pk):
        p = Post.objects.get(pk=post_id)
        return render_to_response('post.html', {
            'post': p
        })
Profiling data
It's very important to use production-like data for profiling. Ideally, you should grab a dump from the production database and use it on your local machine. If you try to measure performance on an empty/small database you can receive wrong results, that don't help you to optimize project correctly.
Load testing
After optimizations, you should perform load testing to make sure that performance is on sufficient level to work on production load. For this type of testing, you need to setup copy of your production environment. Fortunately, cloud services and deploy automation allow us to make such setup in a minute.
I recommend using Locust for load testing. Its main feature is that you can describe all your
tests in plain Python code. You can set up sophisticated load scenarios that would be close to real users behavior.
The example of locustfile.py:
from locust import HttpLocust, TaskSet, task


class UserBehavior(TaskSet):
    def on_start(self):
        """ on_start is called when a Locust start before any task is scheduled """
        self.login()

    def login(self):
        self.client.post("/login", {"username":"ellen_key", "password":"education"})

    @task(2)
    def index(self):
        self.client.get("/")

    @task(1)
    def profile(self):
        self.client.get("/profile")


class WebsiteUser(HttpLocust):
    task_set = UserBehavior
    min_wait = 5000
    max_wait = 9000
Also, Locust provide web-interface to run tests and see results:
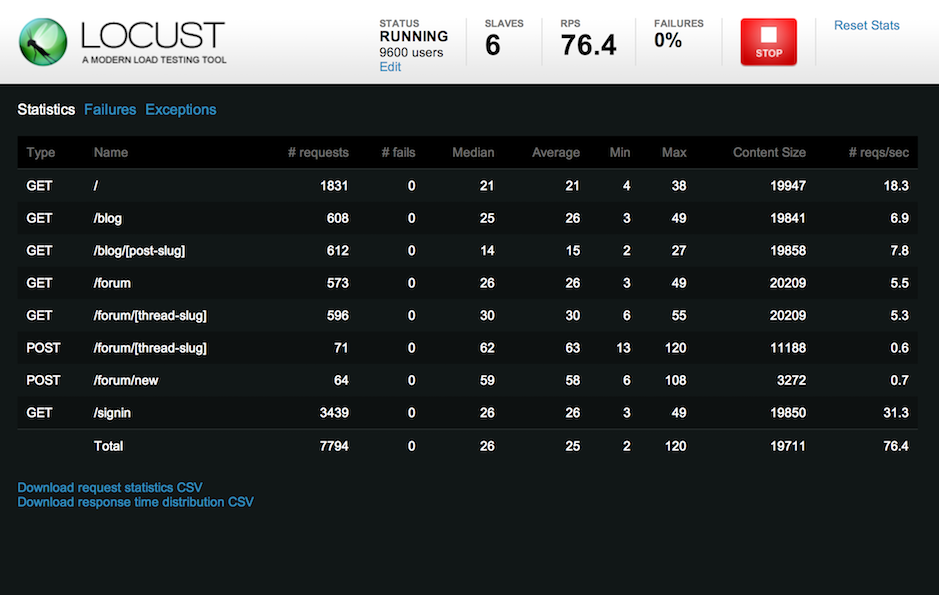
Best thing, that you can setup Locust once and use it to verify project performance after every change. Maybe you could even add it to your CI/CD pipeline!
Django settings
In this section I will describe Django settings, that may affect the performance.
Database connection lifetime
By default, Django closes the database connection at the end of each request. You could setup TTL of a database
connection by changing CONN_MAX_AGE value:
0- close connection at the end of each request,> 0- TTL in seconds,None- unlimited TTL.
DATABASES = {
    'default': {
        'ENGINE': 'django.db.backends.postgresql',
        'NAME': 'mydatabase',
        'USER': 'mydatabaseuser',
        'PASSWORD': 'mypassword',
        'HOST': '127.0.0.1',
        'PORT': '5432',
        'CONN_MAX_AGE': 60 * 10,  # 10 minutes
    }
}
Templates caching
If you use Django version less than 1.11, you should consider enabling templates caching. By default Django (<1.11) reads
from the file system and compiles templates every time they're rendered. You could use django.template.loaders.cached.Loader
to enable templates caching in memory. Add to settings.py:
TEMPLATES = [
    {
        'BACKEND': 'django.template.backends.django.DjangoTemplates',
        'DIRS': [os.path.join(BASE_DIR, 'foo', 'bar'), ],
        'OPTIONS': {
            # ...
            'loaders': [
                ('django.template.loaders.cached.Loader', [
                    'django.template.loaders.filesystem.Loader',
                    'django.template.loaders.app_directories.Loader',
                ]),
            ],
        },
    },
]
Redis cache backend
Django provides several built-in cache backends, such as database backend, file based backend, etc. I recommend to store
your cache in Redis. Redis is a popular in-memory data structure store, probably you already use it in your project.
To set up Redis as cache backend you need to use third-party package, e.g. django-redis.
Install django-redis with pip:
pip install django-redis
Add cache settings to settings.py:
CACHES = {
    "default": {
        "BACKEND": "django_redis.cache.RedisCache",
        "LOCATION": "redis://127.0.0.1:6379/1",
        "OPTIONS": {
            "CLIENT_CLASS": "django_redis.client.DefaultClient",
        }
    }
}
Read full documentation here.
Sessions backend
By default Django stores sessions in a database. To speed up this we can store sessions in a cache. Add to settings.py:
SESSION_ENGINE = "django.contrib.sessions.backends.cache"
SESSION_CACHE_ALIAS = "default"
Remove unneeded middlewares
Check the list of middlewares (MIDDLEWARE in settings.py). Make sure you need all of them and remove unneeded.
Django calls each middleware for each processed request, so there can be significant overhead.
If you have custom middleware, that is used only in the segment of requests, you could try to move this functionality to view mixin or decorator. So other endpoints will not have an overhead of this middleware.